
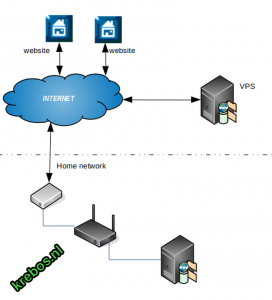
When you run one or several websites or even a (virtual private) server, then it can be handy to monitor these. In this article I will discuss several (proven) setups.
 Nagios / Icinga
- Munin
- Observium
- LogAnalyzer
- Awstats
- Mobile/Android: aNag
- Mobile/Android: Munin for android
- Mobile/Android: PushOver

Nagios / Icinga
Nagios is a very well known monitoring tool and has celebrate a lot of ‘birthdays’. Perhaps a little old-fashioned, but it is doing it’s good job… monitoring. The concept of nagios is working with hosts/services/commands/checks. It is extensively configurable and often a lot overwhelming. So at first keep it simple sunny :). Out of the box it will default monitoring the box you installed nagios (localhost). Okay that is nice, but not the goal we had in mind. We like to monitor for example a website (is it up or not) and we like to do several checks on a virtual private server (VPS). It will take some time before you configured a save way to monitor a remote server/client. I have chosen to do the remote checks over ssh.
 Okay do have also a real example? Ok, my VPS is a linux box and the ‘load’ is a indicator of it’s health. So it makes sense to use a check which looks every 5 minutes what is the load of the machine. In the configuration of this check you can set levels for warning and critical boundaries. If the load exceeds the warning limit, the green box will become yellow and if configured some alarm bells can go of. Because you do not want to look to a screen for too long. I have ‘played’ with the following alerts:
- sending an email
- sending a push message, with pushover
- an android app aNag, which polls the nagios and let your mobile vibrate/ring and LED blinking.
An other example is to ping a specific host/domain, so you know if the host is up/alive. You also can configure website checks, so you know if the website is available and for example is responsive enough. And what is that about Icinga ? As I understand it correctly Icinga is a fork of Nagios. I experimented a while with it. I got a little disappointed when I got stuck with the configure of the remote checks. After a while… why am I struggling with Icinga, when what I want is possible with Nagios….? So I put Icinga aside.
Munin
Munin is also a monitoring tool. To my opinion it is more a graphic generator tool so you can discover trends or strange behavior. But it is also possible to do some alerting with Munin. You have to configure also warning and critical limits. This configuring 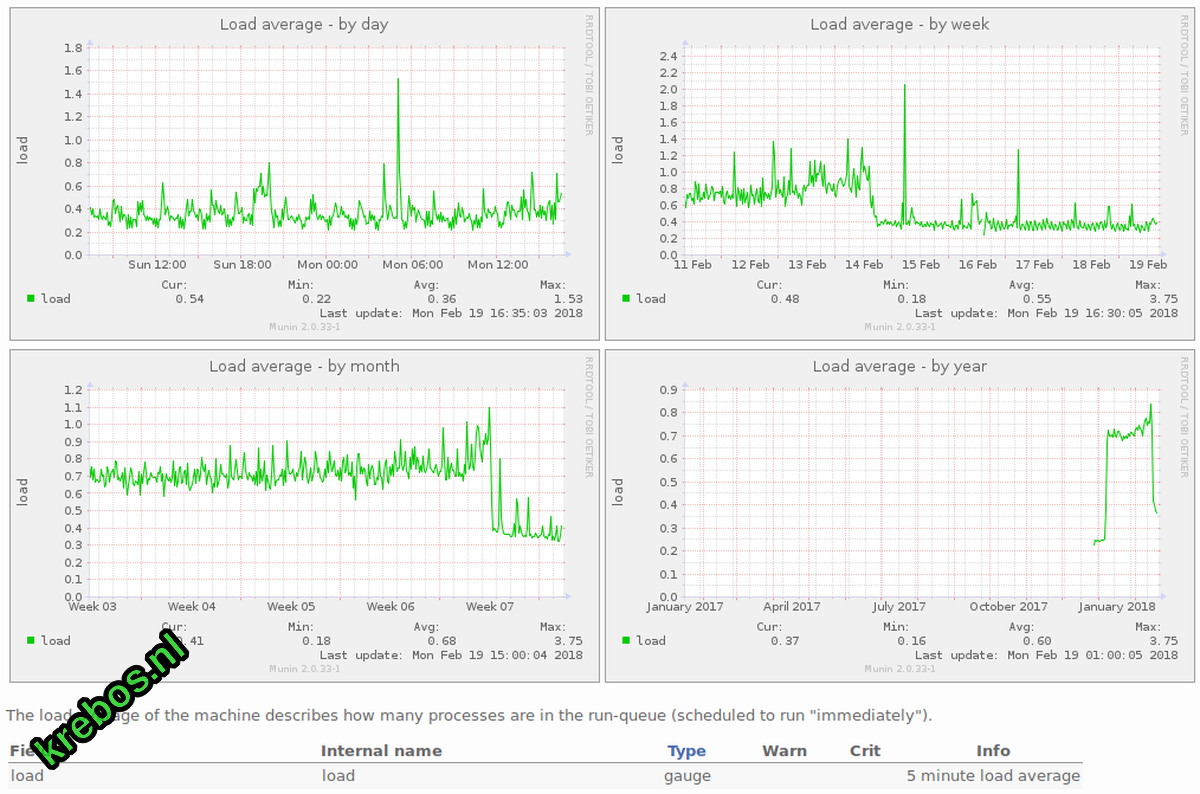 contains a lot of try-and-error loops. And it is not always obvious in what manner you have to configure. The alerting works with the very pleasant “Munin for Android” tool. Munin works with rrd files and create per measure item 4 graphs (day, week, month, year). So you have to be a little patient before you will see the power of the tool.
Observium
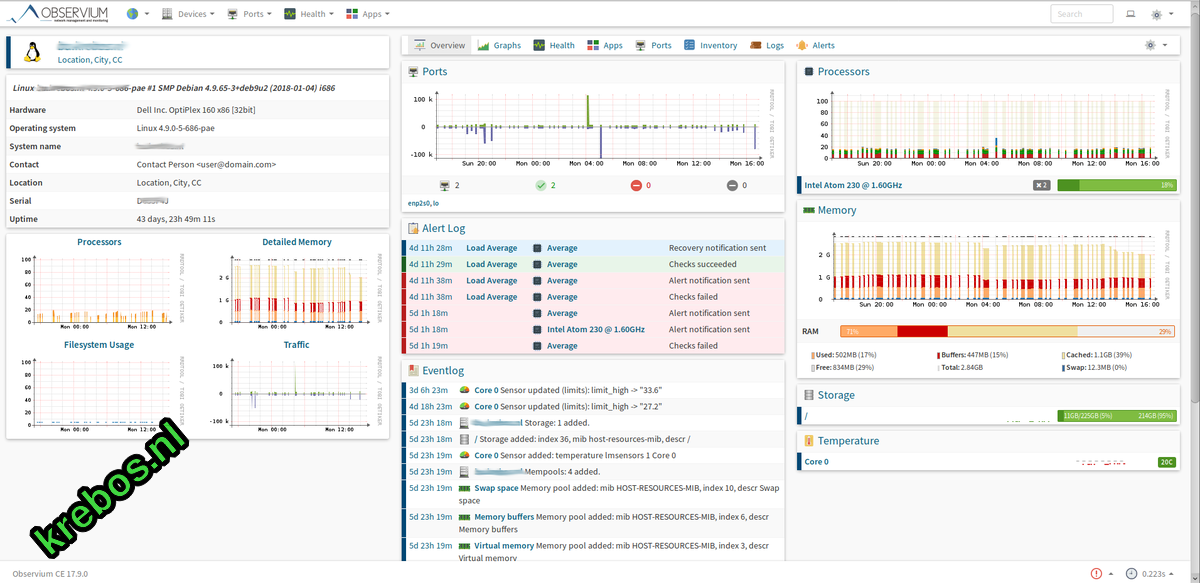
Observium is very nice and powerful tool. It depends heavily on snmp data. Observium also create several rrd files and graphs. It also contains options for alerting based on checks or (when configured) on syslog data. I also configured Observium with alerting by mail and by pushover. Sometimes the GUI is not always logical, but you have to take some time to get familiar with the options. Although there is a graph which shows the logged in users on a VPS it was not possible to create an alert. Based on a chat I learned that it should be possible when you introduce a specific MIB…. but this is only possible with the paid version. I gave up playing with the alerting, and made a descision…. Nagios is the alerting tool, obserium is nice to monitor the health or sometimes to zoom in on strange behavior.
LogAnalyzer
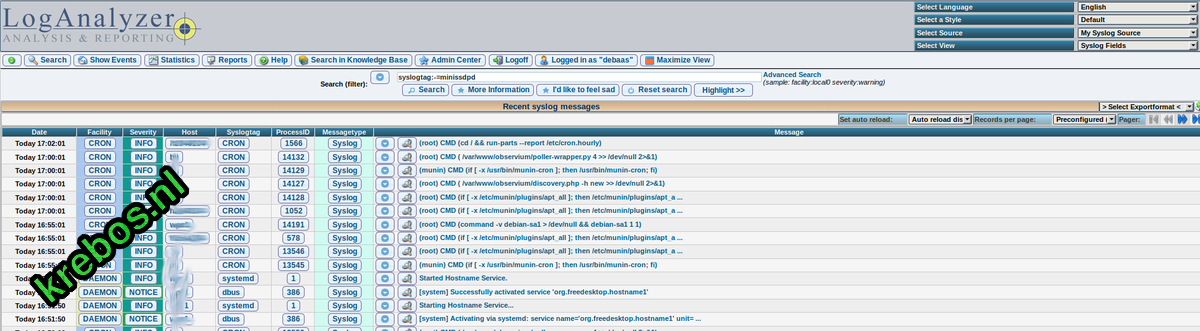
When you do have multiple machines. You can log in to each box and have a look in several logfiles…. or you can configure syslog in such a way that it will deliver the logging to a central syslog. With loganalyzer you access the centralized syslog and do several filter and drill-down actions.
Awstats
Awstats is a (website) loganalyzer, so you can see for example on which hours you get the most visitors. But for example also what kind of browsers or OS they use. For an example of which info awstats reveals have a look at the awstats example
Conclusion
There are a lot of tools/apps which makes it possible to monitor a website or server. It depends on your specific needs what kind of tools are the most suitable for you. In this article I scratched only the surface…. so there is much more te learn and to read 🙂